
Monitoring a WireGuard Tunnel in OPNsense with Uptime Kuma
Uptime Kuma is extremely useful for monitoring self-hosted services. One of the best ways to connect remotely to your services without exposing ports is a WireGuard tunnel. There are many ways to work with WireGuard — to me, OPNsense provides a straightforward way to reach your home services without much configuration.
But there is a problem with this setup: monitoring whether your tunnels are healthy. In my stack I have two different WireGuard tunnels set up, and I use Uptime Kuma to let me know when something is not operational with them. I achieved this with the following versions of those applications:
- Uptime Kuma: 1.23.17
- OPNsense: 26.1.7_1 (amd64)
This post does not cover how to set up tunnels. It assumes you already have them configured and just want to monitor them.
OPNsense: Create a new Group
First, you should create a group to manage access. Under this group you will create the users needed to query your OPNsense instance. To do this, go to System: Access: Groups and using the plus button add a Group like this:
| Item | Value |
|---|---|
| Group Name | uptimekuma |
| Privileges | VPN:WireGuard:Status |
This privilege allows the users under that group to query for the status of a WireGuard tunnel.
OPNsense: Create a new User
On the web UI go to System: Access: Users and create a new user with a password using the same plus button. Do not select any privileges — the user will inherit them from the group we created in the first step.
| Item | Value |
|---|---|
| Username | UptimeKuma |
| Password | *** |
| Group membership | uptimekuma |
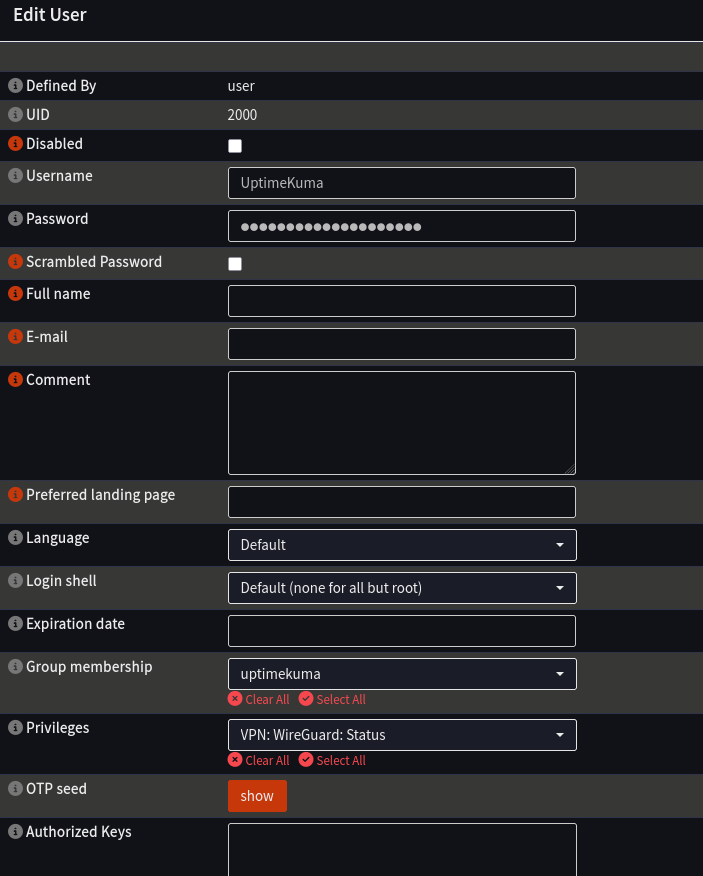
That should be it on the OPNsense side. Now we can test that the user is actually getting correct responses.
Create an API Key for the new user
To authenticate against the OPNsense API you will need to create an API key. This is done from the Users page by selecting the command “Create and download API key for this user”.

It will ask for confirmation and download a TXT file with two details: a key and a secret. You should treat this file as a password and save it in a safe place. We will use these details to call the API.
Test using cURL
Now we can test that we can get the information for the WireGuard tunnels:
curl -k -u "<key>:<secret>" https://opnsense.example.net/api/wireguard/service/show | jq
Where <key>:<secret> are the two values from the TXT file downloaded earlier. Note that -k skips TLS certificate verification — fine for a quick test, but for the Uptime Kuma monitor you should trust your certificate authority instead.
The result of the command is a JSON response with all your interfaces and peers. If you can see this result, the request was successful. The field to check is status, which defines the current state of each tunnel.
{
  ...
  "rows": [
    {
      "if": "wg0",
      "type": "interface",
      "public-key": "XXXXXXXXXXXXXXXX",
      "listen-port": "XXXXXXXXX",
      "fwmark": "off",
      "endpoint": "XXXX",
      "status": "up",
      "name": "YourInterfaceName",
      "ifname": "YourInterface",
      ...
    },
    ...
  ]
}
Uptime Kuma: Create a Monitor
Now, in Uptime Kuma, create a new Monitor of type JSON Query, point it at the same URL, and use a JSON path to select the tunnel’s status field with the expected value up. This table shows the full configuration:
| Item | Value |
|---|---|
| Monitor Type | HTTP(s) - Json Query |
| URL | https://opnsense.example.net/api/wireguard/service/show |
| JSON Query | $.rows[name = 'YourInterfaceName'].status |
| Expected Value | up |
| Authentication | Basic auth — API key as username, API secret as password |
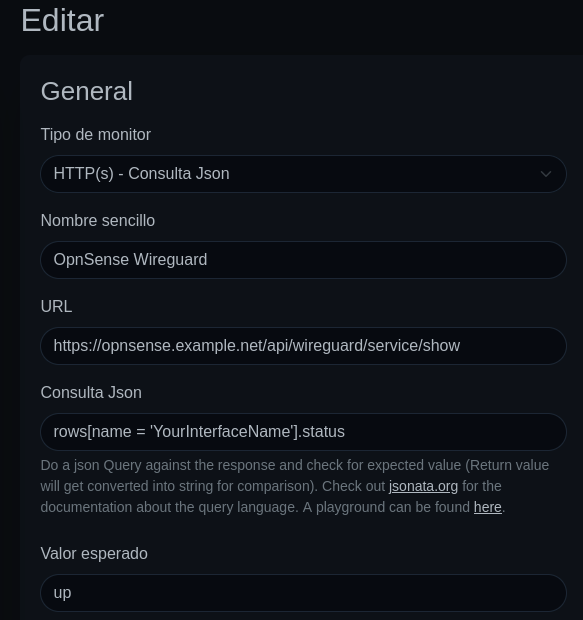
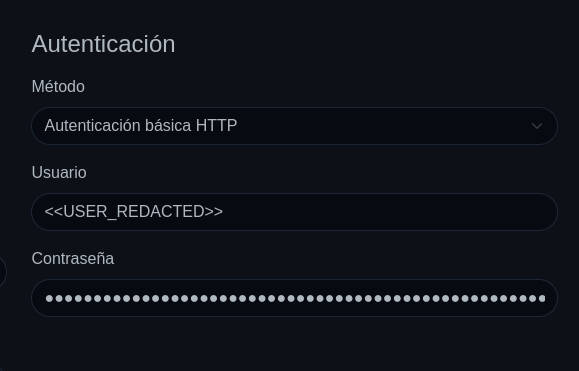
Since the API returns all your interfaces and peers, pin the JSON path to the specific interface you want to monitor — wg0 in this example.
Conclusions
- With a read-only group, a least-privilege API user, and a JSON query monitor, you now get alerts whenever a WireGuard tunnel drops — without exposing a single extra port.
- You can monitor specific WireGuard interfaces and even peers, and get notified when their status changes.
- OPNsense has a rich API, so the same pattern works for any other endpoint — OpenVPN, gateway status, or general service health.
- It all depends on simple protocols, and you can use this information to react to events.
Disclosure: AI was used to improve readability and clarity; the whole process was tested and created by me.